Linklay insights in Google Analytics
|
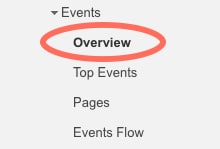
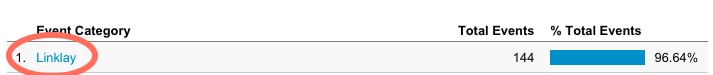
A small but important adjustment has been made to our code, and that is, we’ve now included a Google Analytics webhook to every shoppable image that you embed! If you’re currently using Linklay, don’t worry, you don’t have to change any code or update any settings. Data for all your shoppable images is already stored in Google Analytics. To see how your shoppable images have been performing, following the instructions below: 1. Log into Google Analytics 2. Click “Behaviour” in the left-hand menu 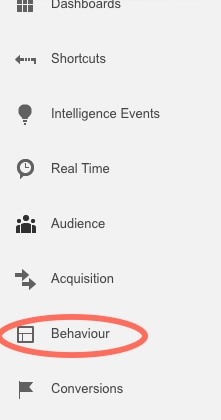 3. Click on “Events” 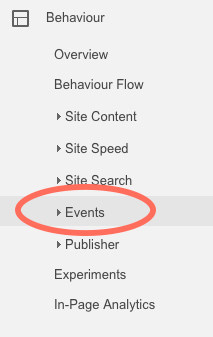
 6. Click “Event Action” to distinguish between clicks on links, and clicks on click-points. 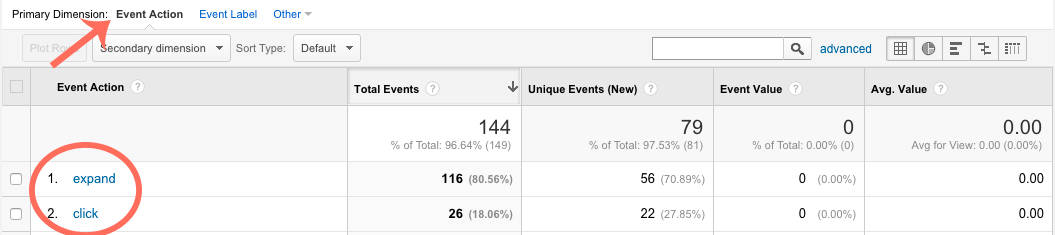 When you click on either “expand” or “click”, you’ll see the URLs associated to those clicks, and how many clicks per URL. To make the most of this data within Google Analytics, select and apply a secondary dimension to discover more about your audience and their behaviour. 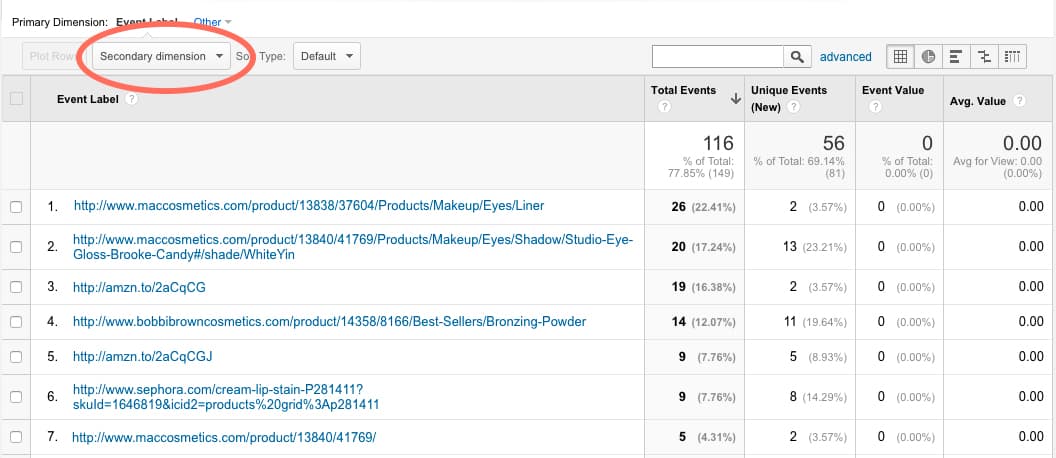 With these insights, you will be able to tell:
Note: It can take up to 48 hours for Google Analytics to store this data. |